
Lean is all about making everything clear and visualized , using Yamazumi chart you can easily visualize waste that lays within the process.
Yamazumi in Japanese language means to stack up , what we stack up here is process steps, lets assume that we have 5 processes with the cycle time shown in the below image and the takt time for this line is 10 seconds .

We can draw a typical line balancing chart as this one to graphically present the processes and the bottleneck.

After studying each process and recording its steps and times we had this table ,so we classify each step to one of three classifications : Value added, Non Value added and Necessary non value added

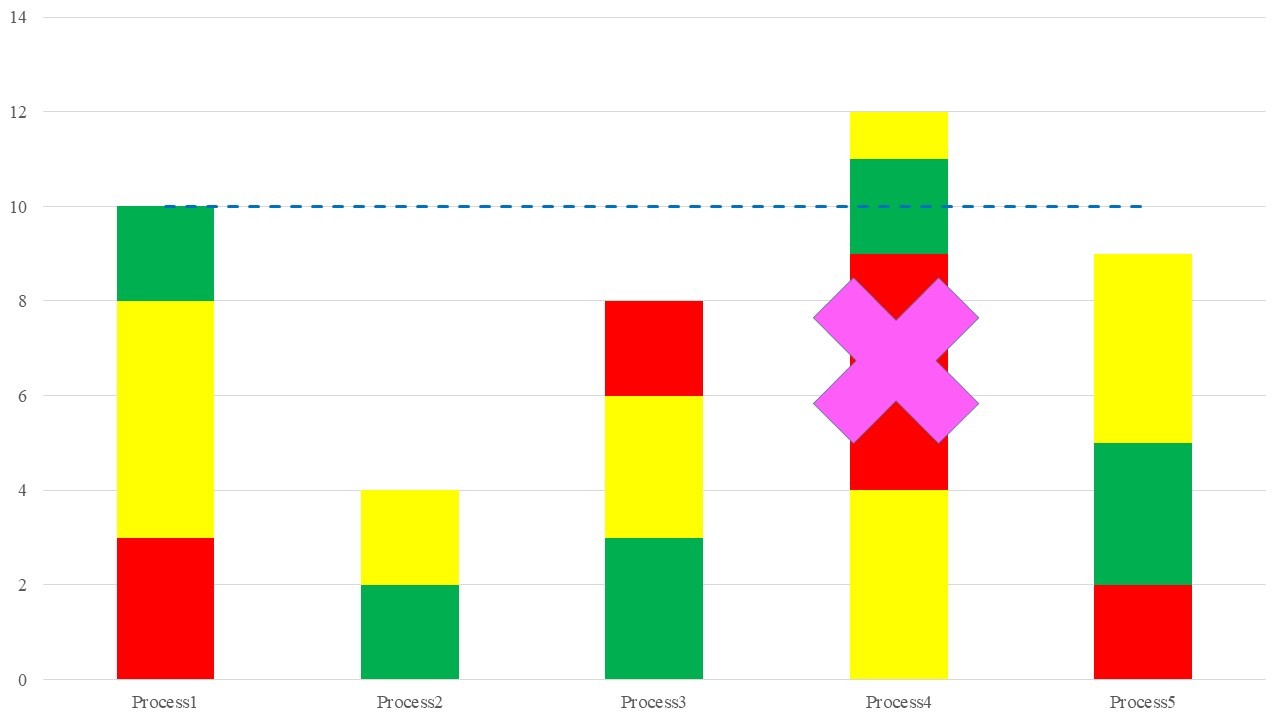
By using Yamazumi Chart you can graphically present these classifications, so we can easily recognize that process4 is the bottle neck and it has non value added time of 5 seconds, if we worked on reducing those 5 seconds , the bottle neck will be solved and the line will meet the takt time.
